Report Design Engineering for Power BI
Learn visual design fundamentals and apply them using Figma, then integrate custom SVG charts into interactive Power BI reports to build professional and impactful dashboards.

Elevate Your Reports to a Professional Level
A specialized course combining visual design fundamentals, Figma tools, and SVG code to build stunning Power BI reports

Professional Bio
I am Abd Al-Rahman Saleh, a Business Intelligence expert specializing in data analysis and the design of advanced analytical solutions. I combine AI and machine learning algorithm development, optimization algorithms, and the building of analytical systems and interactive dashboards — with the goal of transforming raw data into actionable insights that support decision-makers.
Throughout my professional career, I have delivered advanced analytical solutions to companies operating in diverse sectors including shipping and logistics, sales, warehouse management, gold extraction, and financial management. These solutions have empowered organizations to reduce operational costs, increase productivity and profitability, and improve operational efficiency.
What Will You Learn?

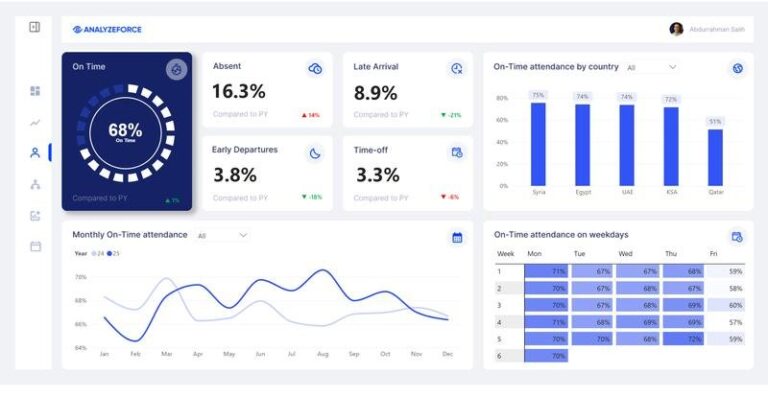
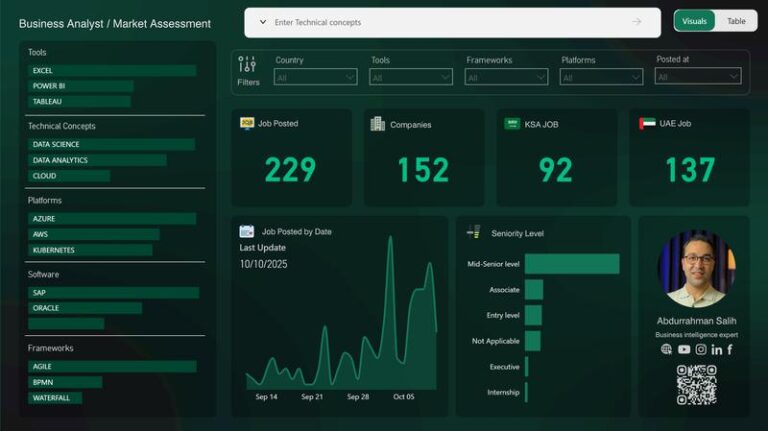
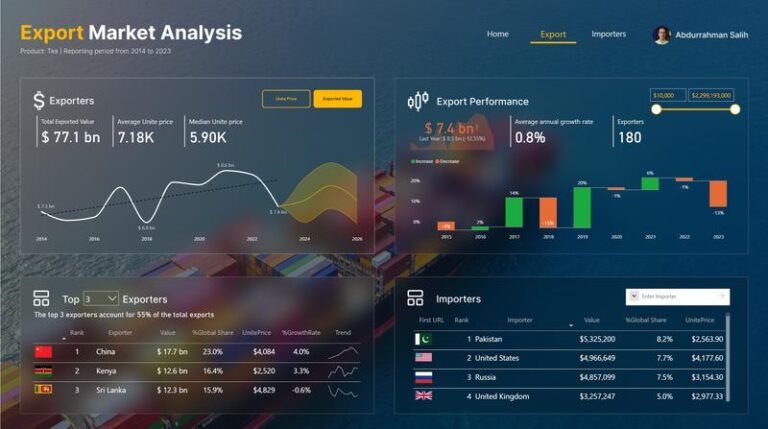
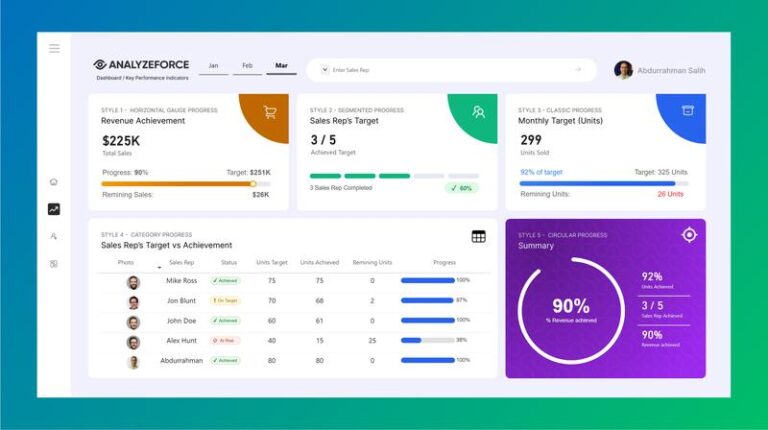
Projects You Will Be Able to Build
Real interactive reports with professional designs you will execute during the training
Detailed Training Content
Three interconnected modules taking you from design fundamentals to hands-on application
Visual Design Fundamentals
Lesson 1
Lesson 2
- Overall Design Vision
- Information Architecture
Lesson 3
- Types of Charts
- Best Practices When Choosing Charts
Lesson 4
- Reading Direction
- Page Division
- Icons
Lesson 5
- Choosing Appropriate Colors
- Color Selection Tools
Lesson 6
- Font Hierarchy
- Best Font Usage Practices
Lesson 7
Figma — From Planning to Design
Lesson 1
Lesson 2
Lesson 3
Lesson 4
Lesson 5
Lesson 6
Lesson 7
Lesson 8
Lesson 9
SVG — Advanced Graphics in Power BI
Lesson 1
- Using SVG in Horizontal Charts
- Using SVG in Filters/Slicers
- Using SVG in Tables
- Using SVG to Design Performance Tracking Charts
Lesson 2
- SVG Code Components
- Basic Shapes
- Drawing a Rectangle with SVG
Lesson 3
Why Is This Training Different?
An integrated learning environment ensuring you the best experience and maximum benefit

Small Group of Trainees
A limited number of trainees to ensure quality interaction and genuine follow-up for every individual

Personal Follow-Up with Every Trainee
The trainer directly monitors your progress and provides personalized feedback tailored to your level and goals

High-Quality Learning Materials
Professionally prepared visual and written content designed for easy comprehension and immediate application

Completion Certificate + Practical Projects
Certificate upon completing the course along with real projects you can add directly to your Portfolio
Register Now and Begin Your Journey
Join the training and develop your skills in professional Power BI report design
Training Price
200 $
- Includes all learning materials
- Completion certificate
- Practical projects for your Portfolio